
2.1.3Who was Riemann?
Area Under a Curve as a Riemann Sum
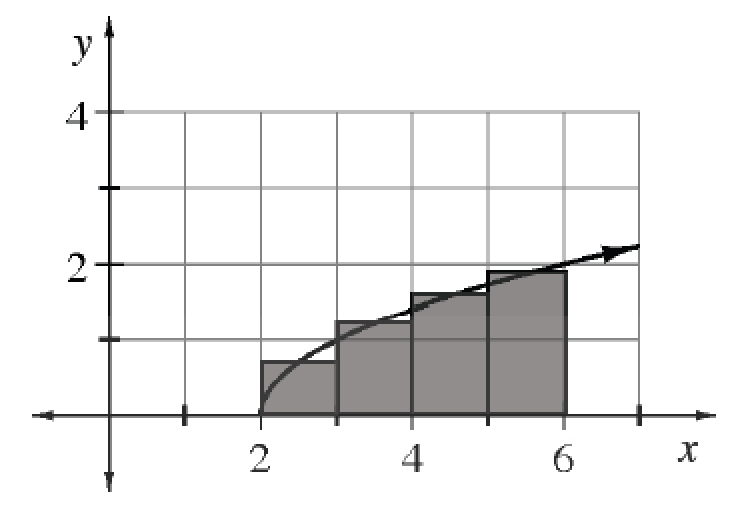
We will examine the graph from problem 2-17 again, but this time we will use twelve left endpoint rectangles to approximate the area under the curve for
Write an expanded sum using the area of each rectangle.
Write and evaluate the summation using sigma notation.
Compare this result to those from problem 2-17. Which is more accurate and why?

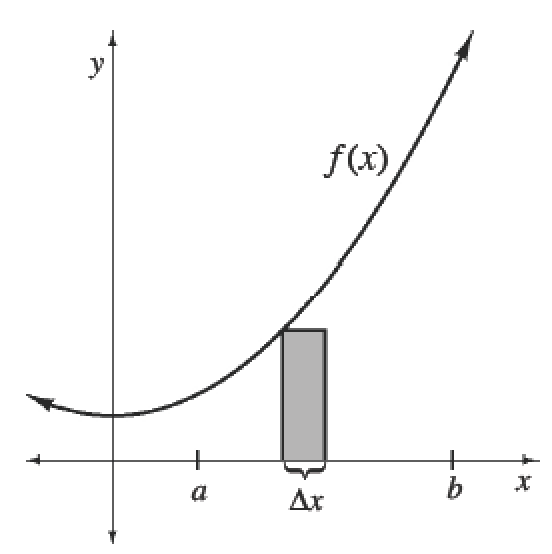
Approximating Area Using Left Endpoint Rectangles
The area under
If each rectangle has a width of
Using rectangles to approximate area under the curve is generally known as a Riemann sum, named in honor of George Friedrich Bernhard Riemann (1826 – 1866).
Use summation notation to write an expression that will approximate the area under the curve for a function
rectangles
rectangles
Rewrite your summation expression from part (a) of problem 2-30 so that right endpoint rectangles are used to approximate the area instead.
Write a general expression using summation notation that can be used to approximate area under a curve using right endpoint rectangles.
Xavier likes things to be exact—he has grown weary of overestimates and underestimates. He thinks he has found a way to calculate the exact area under a curve: midpoint rectangles! Is Xavier correct? Justify your answer by sketching different functions and shading the midpoint rectangles.
The estimation of the area under the curve for
Use sigma notation to write a Riemann sum that describes the given situation.
If the rectangles used in part (a) are rotated about the
-axis, we could use the resulting figure to estimate the volume of the rotated flag. Describe the resulting three-dimensional shape. Include a sketch. Estimate the volume of this rotated region by calculating the volume of each rotated rectangle. How reasonable is this result?
Construct a composite function
Write a thorough description of the function
Calculate the value of the given summation and explain how you found your answer. Homework Help ✎
Is the inverse of an odd function also a function? If the inverse is a function, is it also an odd function? How do you know? Include a statement to support your answer and sketch a graph of an example. Investigate this using the Draw Inverse eToo. Homework Help ✎.
Calculate the volume of the solid formed by rotating the flag bound by the
For the given function, write an expression using summation notation that will approximate the area under the curve for
Rewrite each of the following sums using summation notation. Homework Help ✎


